Free report template with KPIs, a table and a chart
Published 2 min read
Free template
Use this template for free
Create a free account, make a new template in the Code mode and paste the HTML below. Then send your own data from the API.
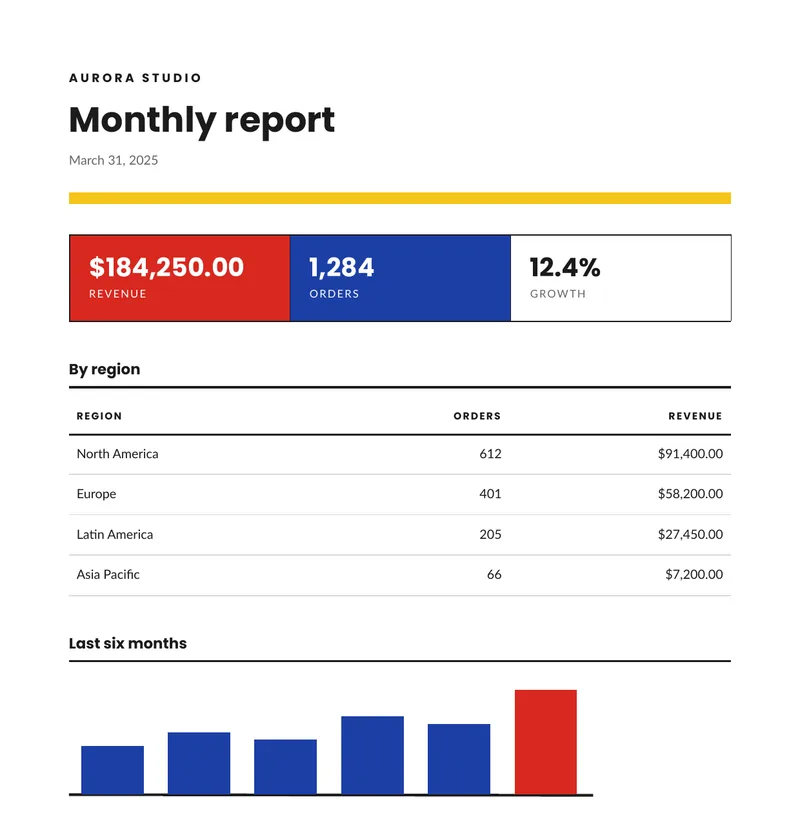
A monthly report has the same three parts every time: the headline numbers, the detail behind them and a trend. This template draws all three in HTML and CSS, and it takes its numbers from your data, so you can produce the report for each month, client or region by sending a different object. Below you can download the sample PDF, copy the code and see the data it takes.
What is in the template
- The company name and the title, with the reporting date written in the long form of the reader’s language.
- Three KPI tiles with a number each: revenue, orders and growth. The first two are colored, and the amounts follow the currency and the locale.
- A table by region with orders and revenue. A header row repeats if the table runs onto another page.
- A bar chart of the last six months, drawn as SVG.
How the chart works
The chart has no library. It is a row of SVG rectangles drawn by a loop over a list of heights:
{% for bar in bars %}<rect x="{{ 12 + loop.index0 * 86 }}" y="{{ 120 - bar }}" width="62" height="{{ bar }}" fill="{% if loop.last %}#d72820{% else %}#1d3fa6{% endif %}" />{% endfor %}Each bar is one value in bars, in points, and the last one is drawn in a different color to
mark the current month. loop.index0 places the bars side by side. Scale your real numbers to
the height of the chart in your own code before you send them.
The renderer draws simple SVG shapes (rect, circle and line) as vectors. That is enough for
bars, lines made of segments and dots. For a chart with curves, labels or a legend, build the
image elsewhere and place it in the document as a PNG.
How to use it
In the portal. Create a free account, click New template, switch to the Code mode and paste the HTML below. You get a live preview.
From the API. Download the HTML and the sample data and send both in one request. This
example uses jq to put the files in the body:
curl -X POST https://api.rustedf.com/v1/render \ -H "Authorization: Bearer $RUSTEDF_KEY" \ -H "Content-Type: application/json" \ -d "$(jq -n --rawfile html report.html --slurpfile data report-data-en.json \ '{html: $html, data: $data[0], locale: $data[0].locale}')" \ -o report.pdfMake it yours
- Tiles. Replace the three KPIs with the numbers that matter to you. The colors are hex values in the CSS.
- Table. The rows come from the
regionslist, so it works for regions, products, accounts or anything else with a name and two numbers. - Language. The labels come from the
tobject. Send anothertand anotherlocalefor a report in another language. - Fonts. The template names
LatoandPoppins. Any Google Fonts family works by name.
See Templates and Supported HTML and CSS.
The template code
<!doctype html>
<html>
  <head>
    <meta charset="utf-8" />
    <style>
      @page { size: A4; margin: 16mm; }
      body { font-family: Lato, sans-serif; font-size: 9.5pt; color: #1b1b1b; line-height: 1.45; }
      h1, h2, .brand, .kpi .num, .label { font-family: Poppins, Lato, sans-serif; }
      table { width: 100%; border-collapse: collapse; }
      td, th { vertical-align: top; }
      .muted { color: #666666; }
      .brand { font-size: 9pt; font-weight: bold; letter-spacing: 2pt; text-transform: uppercase; margin: 0 0 4mm 0; }
      h1 { font-size: 26pt; font-weight: bold; margin: 0; line-height: 1.05; }
      .rule { height: 3mm; background: #f5c518; margin: 6mm 0 8mm 0; }

      .kpi td { width: 33%; padding: 5mm 5mm 5mm 5mm; border: 1px solid #1b1b1b; }
      .kpi .num { font-size: 19pt; font-weight: bold; margin: 0; line-height: 1.1; }
      .kpi .name { margin: 1mm 0 0 0; color: #666666; font-size: 8pt; text-transform: uppercase; letter-spacing: 1pt; }
      .kpi .red { background: #d72820; color: #ffffff; }
      .kpi .red .name { color: #ffffff; }
      .kpi .blue { background: #1d3fa6; color: #ffffff; }
      .kpi .blue .name { color: #ffffff; }

      h2 { font-size: 11pt; font-weight: bold; margin: 10mm 0 3mm 0; padding-bottom: 1.5mm; border-bottom: 2px solid #1b1b1b; }
      .label { font-size: 7pt; font-weight: bold; letter-spacing: 1.2pt; text-transform: uppercase; color: #666666; }

      .rows th { font-family: Poppins, Lato, sans-serif; font-size: 7.5pt; letter-spacing: 1pt; text-transform: uppercase; text-align: left; padding: 2.4mm 2mm; border-bottom: 2px solid #1b1b1b; }
      .rows th.right, .right { text-align: right; }
      .rows td { padding: 2.8mm 2mm; border-bottom: 1px solid #d9d9d9; }
    </style>
  </head>
  <body>
    <p class="brand">{{ company }}</p>
    <h1>{{ t.title }}</h1>
    <p class="muted">{{ period | date(style="long") }}</p>
    <div class="rule"></div>

    <table class="kpi">
      <tr>
        <td class="red">
          <p class="num">{{ revenue | currency(code=currency) }}</p>
          <p class="name">{{ t.revenue }}</p>
        </td>
        <td class="blue">
          <p class="num">{{ orders | number }}</p>
          <p class="name">{{ t.orders }}</p>
        </td>
        <td>
          <p class="num">{{ growth | number(digits=1) }}%</p>
          <p class="name">{{ t.growth }}</p>
        </td>
      </tr>
    </table>

    <h2>{{ t.by_region }}</h2>
    <table class="rows">
      <thead>
        <tr>
          <th style="width: 46%">{{ t.region }}</th>
          <th class="right">{{ t.orders }}</th>
          <th class="right">{{ t.revenue }}</th>
        </tr>
      </thead>
      <tbody>
        {% for row in regions %}
        <tr>
          <td>{{ row.name }}</td>
          <td class="right">{{ row.orders | number }}</td>
          <td class="right">{{ row.revenue | currency(code=currency) }}</td>
        </tr>
        {% endfor %}
      </tbody>
    </table>
    <h2>{{ t.trend }}</h2>
    <svg width="520" height="130" viewBox="0 0 520 130">
      <line x1="0" y1="120" x2="520" y2="120" stroke="#1b1b1b" stroke-width="2" />
      {% for bar in bars %}
      <rect x="{{ 12 + loop.index0 * 86 }}" y="{{ 120 - bar }}" width="62" height="{{ bar }}" fill="{% if loop.last %}#d72820{% else %}#1d3fa6{% endif %}" />
      {% endfor %}
    </svg>
  </body>
</html>
The sample data
{
  "locale": "en-US",
  "currency": "USD",
  "company": "Aurora Studio",
  "period": "2025-03-31",
  "revenue": "184250.00",
  "orders": 1284,
  "growth": 12.4,
  "bars": [
    48,
    62,
    55,
    78,
    70,
    104
  ],
  "regions": [
    {
      "name": "North America",
      "orders": 612,
      "revenue": "91400.00"
    },
    {
      "name": "Europe",
      "orders": 401,
      "revenue": "58200.00"
    },
    {
      "name": "Latin America",
      "orders": 205,
      "revenue": "27450.00"
    },
    {
      "name": "Asia Pacific",
      "orders": 66,
      "revenue": "7200.00"
    }
  ],
  "t": {
    "title": "Monthly report",
    "revenue": "Revenue",
    "orders": "Orders",
    "growth": "Growth",
    "trend": "Last six months",
    "by_region": "By region",
    "region": "Region"
  }
}Keep reading
Free templates
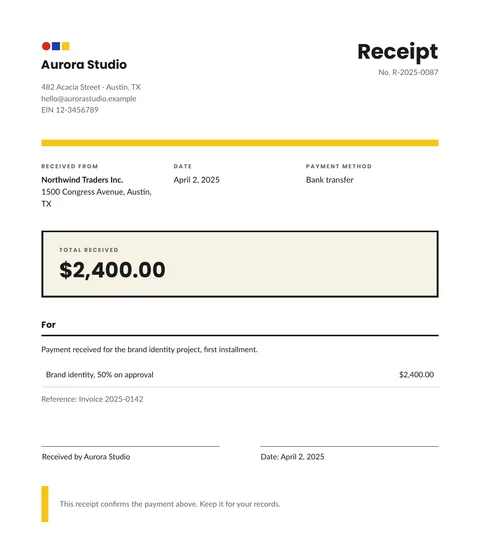
Free receipt template: HTML and PDF you can copy
A free receipt template in HTML and CSS with the payer, the date, the method, the amount received and a signature line. Copy it and use your own data.
2 min read
Free templates
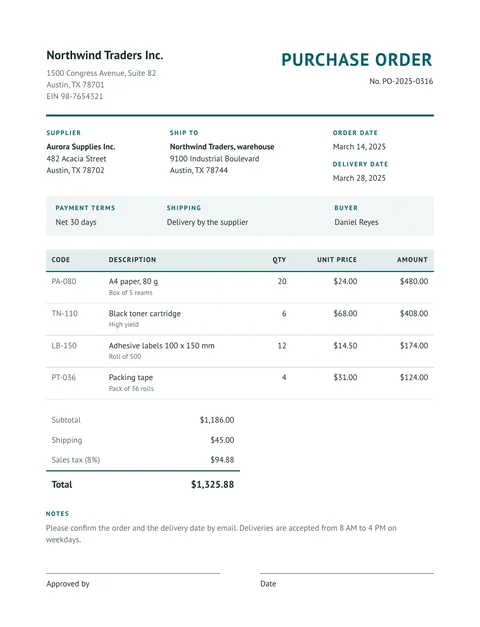
Free purchase order template: HTML and PDF you can copy
A free purchase order in HTML and CSS: buyer, supplier, delivery address, payment terms, an items table with totals and an approval line. Copy it and use your data.
2 min read
Free templates
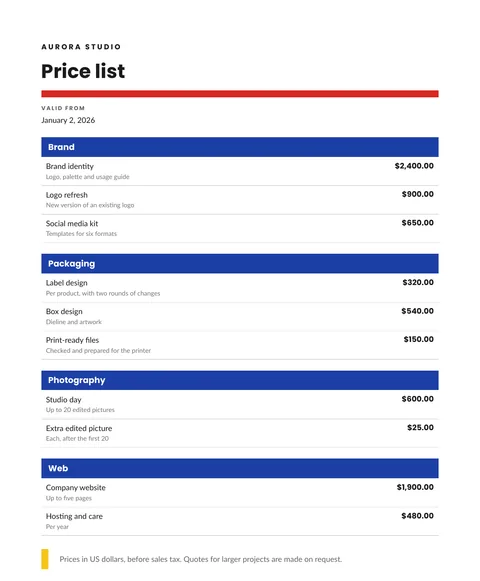
Free price list template: groups, items and prices in PDF
A free price list in HTML and CSS: items grouped by category, a short detail for each, prices in the right currency and a validity date. Copy it and send your data.
2 min read
Free templates
Free delivery note template: HTML and PDF you can copy
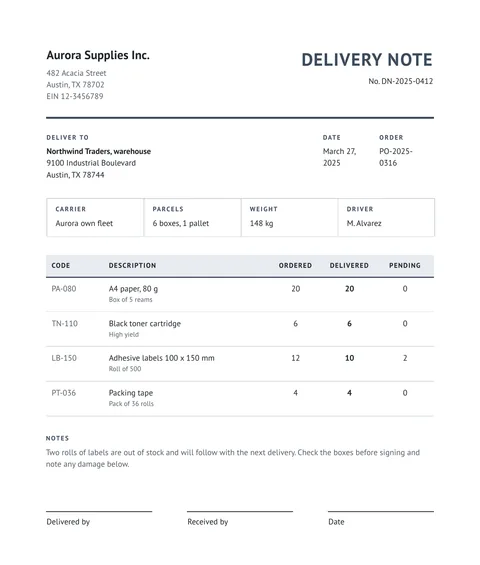
A free delivery note in HTML and CSS: sender, recipient, carrier, ordered, delivered and pending quantities, and three signature lines. Copy it and use your data.
3 min read